57 million children travel daily to and from school in America, either walking, biking, taking the bus, or are being dropped off. School safety zones require drivers to slow down and take precaution for potential children that may be around: however, traffic accidents are the leading cause of injuries/death for school-aged children.
School safety zones are the most prevalent for a child to be struck by a vehicle compared to any other location. A first step in correcting this issue is acquiring a better understanding of the zones themselves, and the consequences of inattentiveness.
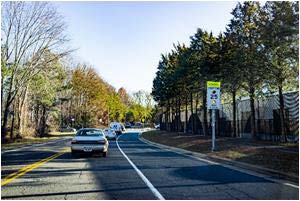
School zones require drivers to slow down
School zones are areas outside of schools, playgrounds, and areas immediately around any type of school bus or transport vehicle with children being both picked up and dropped off.
“There has been a 13% increase in the pedestrian death rate for 12-19-year olds since 2013” (SafeKids, 2016). In 2015, teens between the ages of 15-19 made up 26% of all children aged 0-19: however, teens made up 49% of total pedestrian fatalities for the year. Safe Kids World Wide estimated that nearly 300 teens were hit and killed by cars while walking in 2015.
It’s this common-sense notion that might make “But no children were present,” seem like a logical argument for speeding in a school safety zone, but that is simply not the case. The time period between 7-8 am and 3-4pm are the central times fatalities occur but are not the only times they do occur. “About half of all deaths of children are in or near school zones involve kids who are 15 and older” (Timothy J. Ryan & Associates,” 2018).
It is important for us to understand the causalities of even speeding 5 mph over the enforced speed limit in school zones, and for that matter, anywhere. A pedestrian hit at 20 mph has a 95% chance of living. That same person is instead hit by a vehicle travelling more than 40 mph has an 80% chance of dying.
Furthermore, “At 25 mph, the stopping distance for an average vehicle and driver with average reaction times is at least 56 feet. At 35 mph, the stopping distance is at least 95 feet. Traveling at a normal speed instead of slowing down for the school zone therefore adds 40 feet to stopping distance” (Timothy J. Ryan & Associates,” 2018).
The failure to follow school zone speed limits is the reason why these accidents continue to happen.
In addition, child and teen distracted walking is gaining momentum: 25% of high school students and 16% of middle school students were found to be walking distracted.

Pedestrians will look at their phones while walking
44% of distracted teens were wearing headphones
The following statistics were conducted by Zendrive’s 2018 School Safety Snapshot that analyzed risky driving behavior within a quarter-mile of 125,703 elementary, middle and high schools across the country: looking at the frequency of driver’s phone use, speeding, aggressive acceleration and hard breaking during the month of April 2018. Reviewed 10.5-billion-miles of data, driven by 9.1 million-anonymous drivers, who took 1-billion trips over the one-month study. The database contained 71,282 elementary schools, 40,343 middle and high schools, 6,816 schools that are combined, 7,262 schools that fit another category. 25% in rural areas, 12.5% in towns, 33.5% in suburban, 29% are in cities.
Download and read the full study.
Overall, America has had little to no improvement in driver behavior in around 90% of the schools throughout the country. Instead, risky driving behavior has become three times worse since 2017. Whether you are located in a city, suburb, town, or rural area, worsening driving behavior is almost equally divided among all parties.
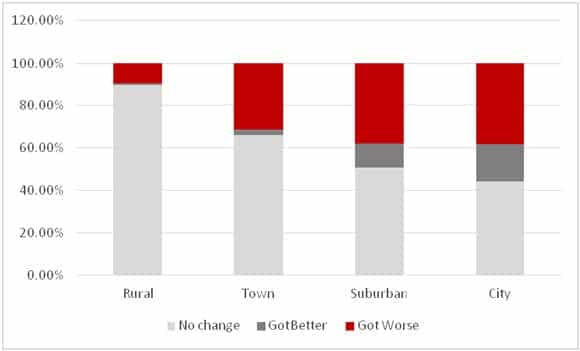
Chart showing the Change in Driver Behavior By School Location: 2017 vs. 2018
Zendrive’s findings conclude that road type and land use are some of the biggest factors in risky driving behavior around schools. There is a higher number of dangerous drivers in urban schools than rural schools: however, there are 32% more risky drivers around city schools than rural schools. The type of school did not matter. Even with 76.9% of high school-aged students getting to school by a private vehicle, parents are unable to say that teenage drivers skew the numbers.
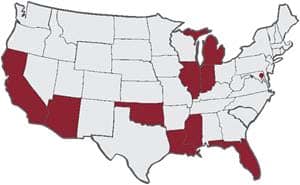
Graphic showing the 10 states with the most distracted drivers
California, Florida, Illinois, district of Columbia, Louisiana, Mississippi, Arizona, Michigan, Oklahoma, Indiana
*The District of Columbia, Mississippi, Louisiana, and Oklahoma also rank in the ten worst states for distracted driving, with drivers using their phones for almost 7.5% of the time they’re driving each day.
One child is one too many. Changing driving behaviors is not only a government officials’ job, it is the job of every person who chooses to get behind the wheel. Understanding the implications of distracted driving and implementing better practices to help keep our roadways safe starts with us, the civilians. Anyone can give you a ticket, it is up to you to change the way you drive.
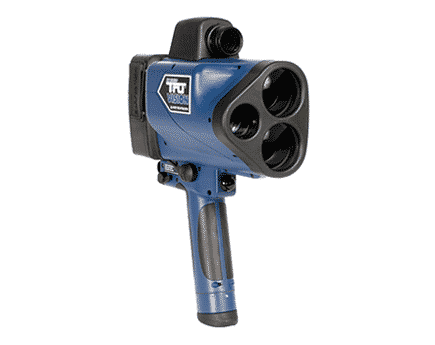
Laser Tech’s TruVision photo/video lidar speed gun
If you are a part of traffic enforcement, check out LTI’s 20/20 TruVISION™ handheld speed enforcement device that equips police agencies to enforce it all with next-level video/photo enforcement. LTI’s patented following too closely technology, assists in tailgating enforcement, aggressive and distracted driving, obstructing traffic, and the misuse of HOV lanes. The TruVISION is the most effective enforcement tool in the market today to change risky driving behaviors and saves lives.
Discover the TruVISION laser speed gun
See our other LTI traffic safety products
Sources:
S. (2016, October). Alarming Dangers in School Zones. Retrieved December 03, 2018, from https://www.safekids.org/sites/default/files/alarming_dangers_in_school_zones.pdf
(2018, January 26). Statistics on School Zone Accidents | Timothy J. Ryan & Associates. Retrieved December 03, 2018, from https://tjryanlaw.com/school-zone-statistics/
Zendrive Inc. (2018, August). Back to School 2018. Retrieved December 06, 2018, from https://go.zendrive.com/school-safety-2018
Contact us today for more information about LTI's traffic safety devices, or to schedule a practical demonstration
Contact Us